|
Home
Up
Co-brand
Partnerships


| |
| 3/03/99 General Electric (GE)
Points to watch: The charts of GE and the
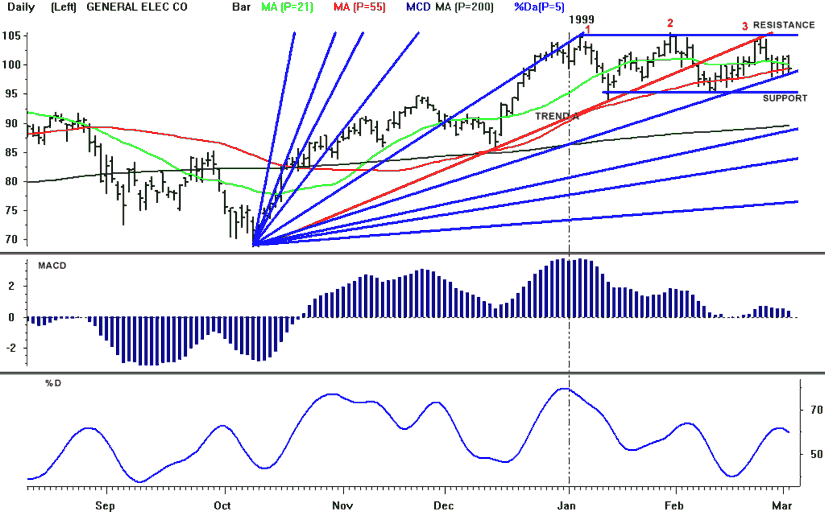
S&P500 since the beginning of the year are almost identical. Both GE and the
SP500 are forming triple tops (1,2,3 on chart below), and both have been locked in trading
ranges since January (support, resistance on chart below). GE has been in a trading
range between 95-105 since January. On February 5th GE broke below trendline support
(trend A on chart). This trendline had provided support on 3 occasions since the
October lows. The trendline acted as resistance in late February when GE tested, and
failed to break above it--a bearish sign. GE has fallen below its 21 day(100.1)
moving average. The 55 day moving average (99.4) has provided support
over the last 2 weeks. A break below this level would be bearish--GE has remained
above its 55 day M.A. since breaking out to the upside in mid October. There is Gann
support at 98.63 which has held over the last 4 days, a break below this level would also
be a negative. MACD and stochastics have both shown a strong negative divergence
with price during each of the 1999 price peaks (1,2,3 on chart). The indicators have had
lower highs on each of the 3 peaks in price. This is also a negative for GE shares.
The stock is likely to make another run at the lower end of its trading range.
A fall below 95 would confirm the triple top that has been forming. On a
break below the lower end of the trading range look for GE to next find support at 87--the
50% retracement of its rally from the October lows.
|

|
