|
Home
Up
Co-brand
Partnerships


| |
| 3/02/99 Apple Computer (AAPL)
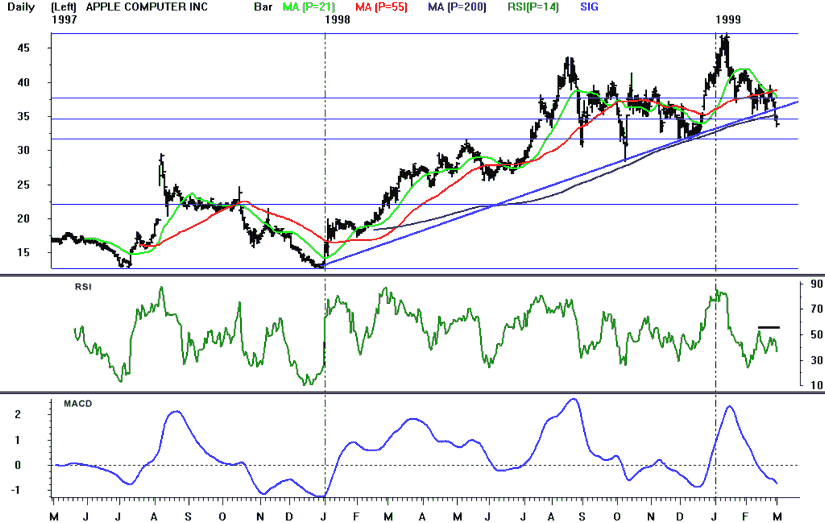
Points to watch: Apple shares have broken below
key support levels over the past week. The shares fell below their 200 day moving
average (35.19) for the first time since February 1998. AAPL has also fallen below
Gann 1x1 support (from the 7/97 lows) at 35.3 on its weekly chart. The stock has
broken below the up trendline (now at 36) drawn from the 12/97 lows which acted as support
in October and December. Technical indicators continue to deteriorate. Weekly
RSI and MACD showed strong negative divergences with price during the January high and
both indicators are in downtrends. Weekly OBV turned down in early January
and daily MACD (MACD gave a sell signal on 2/10), OBV, and RSI are declining. Strong
support exists just below the current share price at 32. This support level held in
late-August, October, and December. Sell, or short, Apple if it breaks below the key
32 support level.
|

|
