|
Home
Up
Co-brand
Partnerships


| |
| 3/25/99 Illinois Tool Works
(ITW)
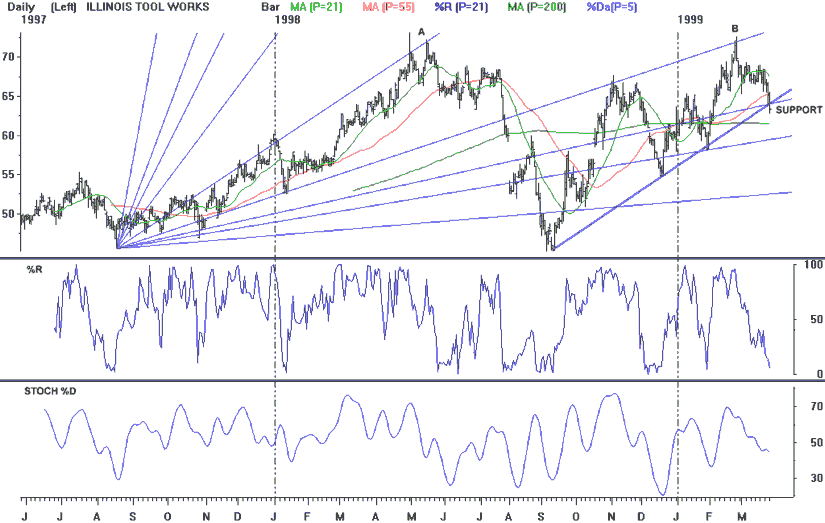
Points to watch: ITW's February rally was
stopped by resistance at 72, a level which also stopped the stock's rally last April and
May (A and B on chart). The stock's last 2 rally attempts were stopped by Gann
resistance in November and February (B on chart). The stock has fallen below its 21
day moving average (67.5). On Monday, the stock fell below 2 important support
levels, 65.8 (the 25% retracement of its 9/98-2/99 rally) and its 55 day moving average
(64.43). Yesterday ITW closed below an uptrendline (drawn from its September lows)
which had provided support on previous tests in December and January. Long and short
term technical indicators have turned negative. Daily MACD gave a sell signal on
2/25, and daily stochastics, OBV, and RSI are in downtrends. Weekly stochastics has
given a sell signal, and weekly RSI showed strong negative divergence with price during
the February top. Sell, or short, if the stock breaks below its 200 day moving
average at 61.5.
|

|
