|
Home
Up
Co-brand
Partnerships


| |
| 3/22/99 AT&T CORP (T)
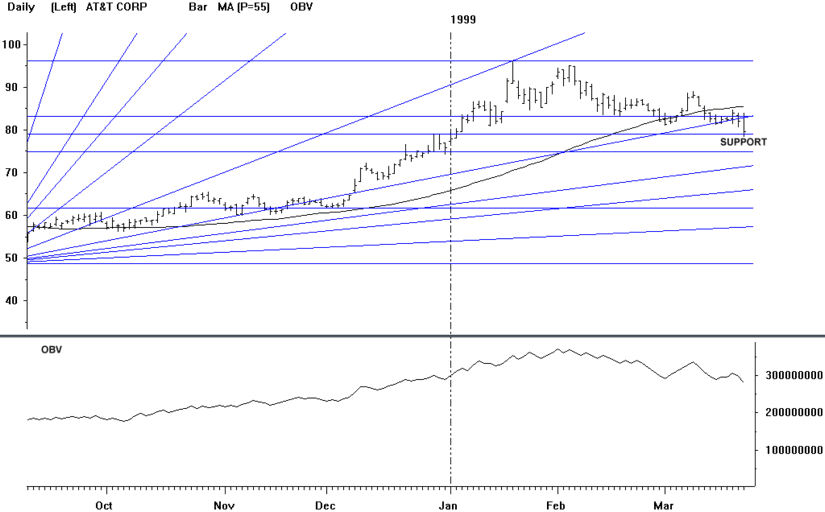
Points to watch: T peaked in January at 96.
The stock made a failed attempt at the old highs in late January/early February.
Daily OBV turned down in early February, and weekly OBV turned sharply lower in
late January. Daily MACD and RSI are in downtrends. Weekly RSI and stochastics
have given sell signals. On March 10th the stock fell below its 55 day moving
average (85.4). Friday the stock fell below Gann angle support (83.13 on
chart) which had held since December 8th. Intraday, T tested the 50% retracement
level (of its November-January up swing) at 78.7. The 78.7 level acted as resistance
on 12/29 & 12/30. Short on a break below the 50% retracement level. Upside
resistance is at 84.5 (the 25% retracement of the September-January rally).
|

|
