|
Home
Up
Co-brand
Partnerships


| |
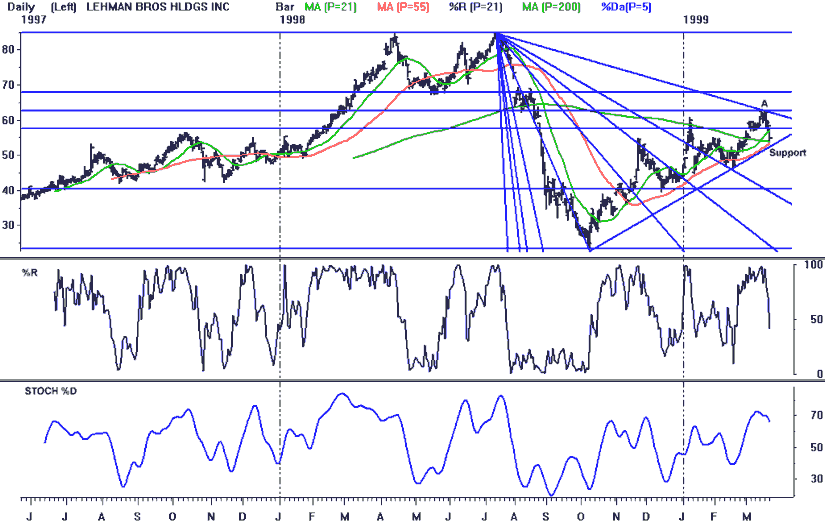
| 3/24/99 Lehman Brothers (LEH)
Points to watch: Lehman's rally was stopped
last week at 62-62.5, the point where key Gann angle resistance and Fibonacci resistance
levels converged (point A on chart). Stochastics and MACD have given sell signals.
Daily RSI and OBV have entered downtrends. The stock has fallen below its 21 day
moving average, and is nearing its 200 day moving average (53.8) which has acted as a
support/resistance point since last July. Sell, or short the stock on a break below
trendline support at 52.5
|

|
