|
Home
Up
Co-brand
Partnerships


| |
| 6/07/99 Danka Business Systems (DANKY)
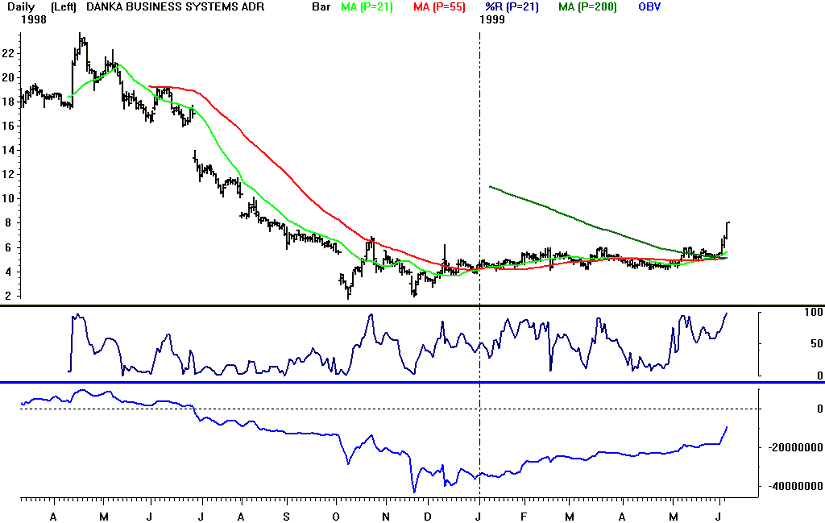
Points to watch: Danka is showing signs of breaking out to the upside after forming a solid bottom over the past 8 months. The stock broke above its 200 day moving average on May 19th, and the 200 day M.A. has acted as support on 3 occasions since the break. On May 28th the stock's 21 day moving average crossed above the 200 day for the first time in a year. Technical indicators are positive: %R is confirming the move and daily MACD gave a buy signal in mid April. Weekly OBV turned up in November and daily OBV has been rising since December, with a sharp turn to the upside in early June. On Friday the stock closed above its 55 WEEK moving average (7.2) for the first time since it dropped below it on 10/26/97. Downside support is at 6-6.5.
|

DISCLAIMER
|
