|
Home
Up
Co-brand
Partnerships


| |
| 5/27/99 Ross Stores
(ROST)
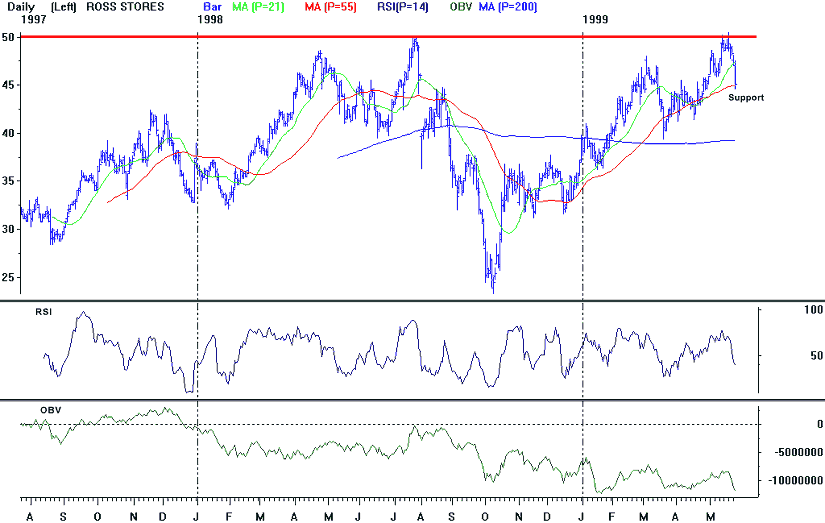
Points to watch: ROST's post October rally
stopped on May 19th at 50.5, a level which also acted as resistance last July. The
stock has since fallen below its 21 day moving average (47.33) for the first time since
April 26th. Ross Stores closed at important support yesterday. The stock
closed at its 55 day moving average (45) which has acted as support since mid November.
Technical indicators are negative: OBV showed a negative divergence with price
during the May peak, stochastics and RSI are in downtrends. On a break below 45 the
stock will next find support near its 200 day moving average (39).
|

|
