|
Home
Up
Co-brand
Partnerships


| |
| 5/24/99 Telecom New Zealand
(NZT)
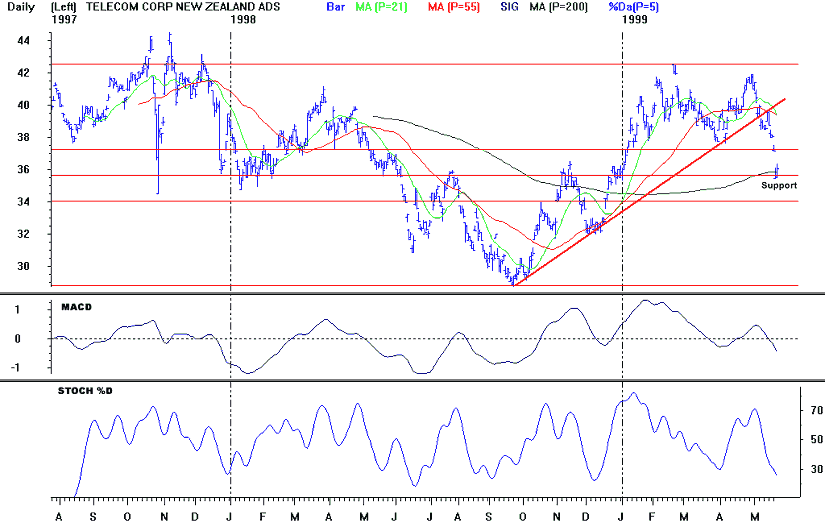
Points to watch: On May 7th NZT fell below the
up trendline (drawn from the September lows) at 40.13 which had acted as support in
December 1998 and again in April of this year. The stock subsequently attempted a 2
day rally which was stopped both days at the trendline (which had become resistance).
The stock then resumed its decline, and daily MACD gave a sell signal last Monday.
On Thursday and Friday the stock held important resistance on a closing basis: its
200 day moving average (35.87) which it has traded above since 12/21, and the 50%
retracement level (of its September-February rally) at 35.63. A sell signal would be
given with a break below these 2 resistance levels. Upside resistance is at the 38%
retracement level at 37.63.
|

|
