|
Home
Up
Co-brand
Partnerships


| |
| 5/19/99 American Home Products
(AHP)
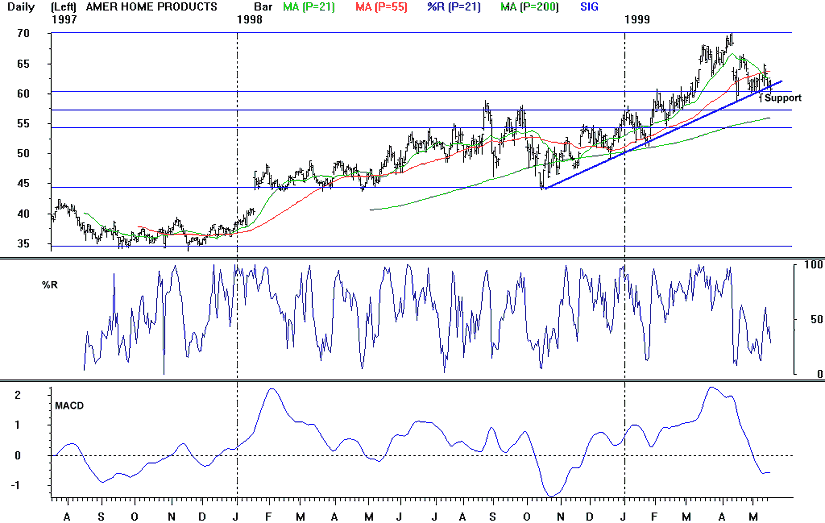
Points to watch: AHP peaked on April 13th at
70.25. The stock began to weaken shortly after, with daily MACD giving a sell signal
on May 3rd. AHP is now trading below both its 21 day (62.62) and 55 day (63.78)
moving averages. The stock closed just below the trendline support at 61 yesterday.
This trendline has provided support on 12/18, 1/22, 1/26, and throughout April and
May. Fibonacci support at 60.38 (the 38% retrace of the 10/98-4/99 rally) is
directly beneath. The 38% retrace at 60.38 acted as resistance in February and has
provided support in April and May. A sell signal would be given with a break below
these two support levels.
|

|
