|
Home
Up
Co-brand
Partnerships


| |
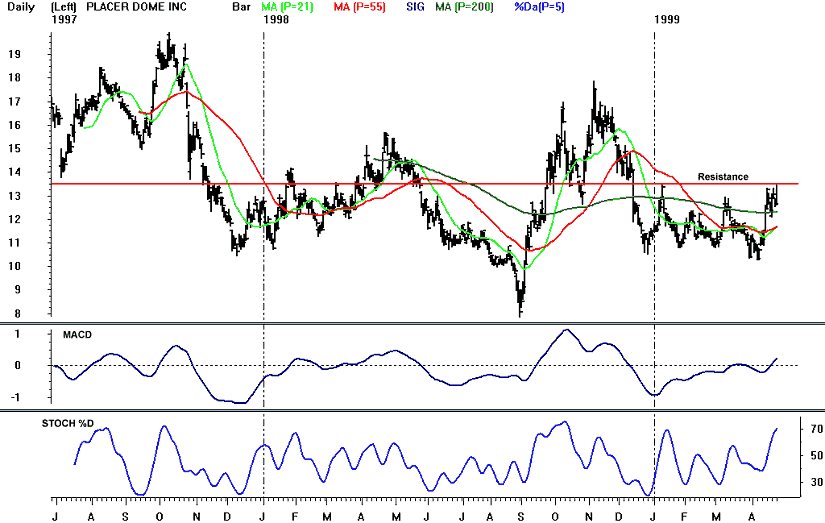
| 4/28/99 Placer Dome (PDG)
Points to watch: A strong double bottom has
formed on PDG's chart, with lows in December and April. A close above resistance at
January's high of 13.5 would confirm the double bottom and signal a change of the
intermediate and long term trends to the upside. PDG moved above resistance at 12.88
(the 50% retrace of the 8/31/98-11/5/98 rally), and above its 200 day moving average
(12.33). Weekly MACD gave a buy signal on 4/16 and daily MACD gave a buy signal on
4/22, reversing the sell signal given on 12/10. Daily MACD also showed a strong
divergence with price action during early April's second bottom. Daily stochastics
is in an uptrend, and weekly stochastics gave a buy signal on 4/9. Watch for a break
above 13.5.
|
|

