|
Home
Up
Co-brand
Partnerships


| |
| 4/7/99 Chiron (CHIR)
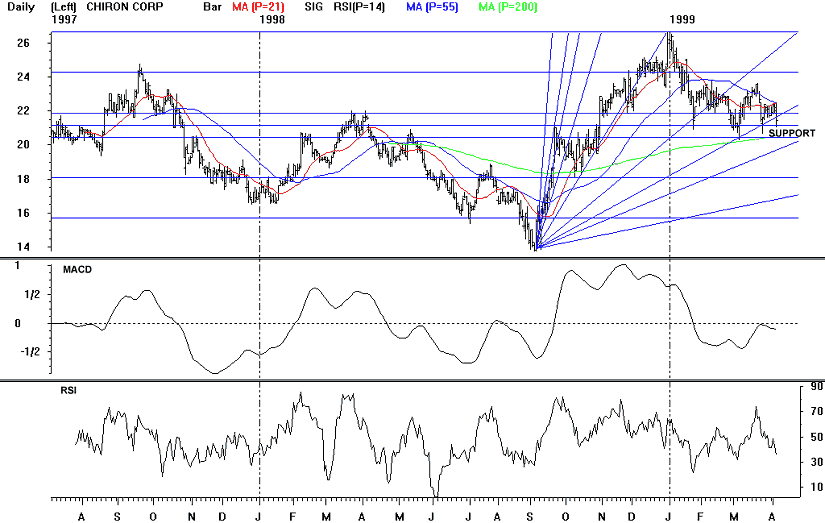
Points to watch: Chiron peaked on December 31st
and has spent the first part of this year in a downtrend. Daily MACD gave a sell signal on
1/25, and daily RSI gave a sell signal on 3/19. Weekly RSI and MACD are in
downtrends. The stock is trading below both its 21 day (22.41) and 55 day (22.45) moving
averages. Yesterday the stock closed below Gann angle support at 21.63 which had
held on 2 previous tests on 3/4 and 3/24, and below the 38% retracement level (21.7, 38%
retrace of its 9/98-12/98 rally). The stock tested and held support at 21.25
intraday--this level has acted as support since 1/25. Additional downside support exists
at 20.8 (the 50% retrace of the rally from the 5/95 lows to the 3/96 all time high).
Sell on a close below 20.8.
|

|
