|
Home
Up
Co-brand
Partnerships


| |
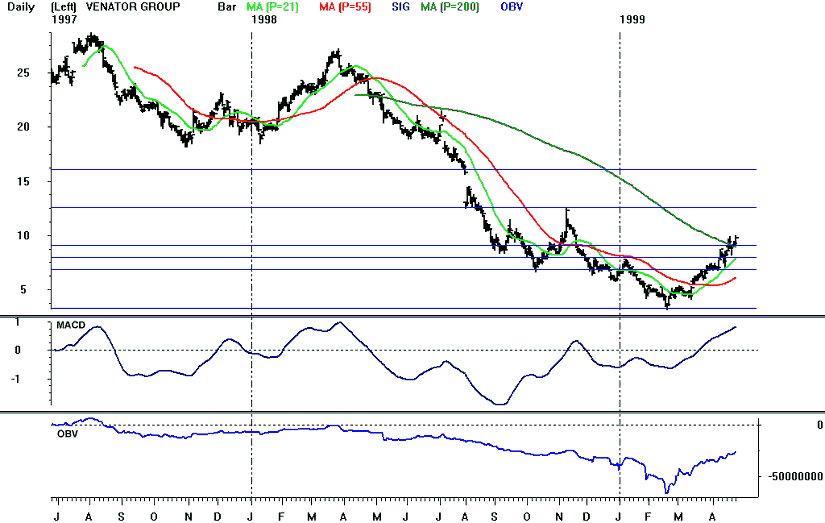
| 4/26/99 Venator Group (Z)
Points to watch: Venator was in a steep
downtrend from May 1998 to February 1999. The stock has been forming a solid bottom
pattern since the first stage of its decline ended last October. Technical
indicators help confirm that a final bottom was put in place in February. Weekly
MACD and RSI both showed strong divergences with price at the February bottom.
The stock is in an intermediate term uptrend and is showing signs of being
ready to break out solidly to the upside. Daily OBV turned up in February and daily
MACD gave a buy signal on 3/19. On April 16th the stock moved above its 200 day
moving average (8.95) for the first time since May 1998. The stock closed near
resistance at 9.98 (the 25% retracement of the 3/98-2/99 decline) on Friday. The
stock must successfully break above this resistance for the long term trend to change to
up. Weekly stochastics is overbought and a short term correction is possible before
the stock breaks above resistance. Downside support exists at 9 (the 62% retracement
of the 11/98-2/99 swing down). Additional strong downside support exists at 7.75-8
(the 50% retrace of the November-February decline). Watch the stock for a break
above 10.
|

|
