|
Home
Up
Co-brand
Partnerships


| |
|
10/25/99
Sonat Inc (SNT)
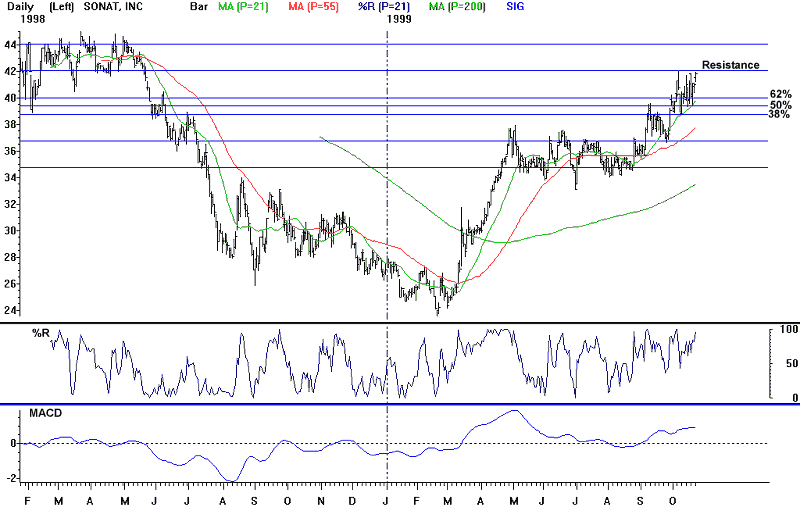
Points to watch: Sonat
hit a 52-week high of 42 on October 7th. The stock then retraced 50%
of its 9/27-10/7 swing up, and has spent the past 3 weeks consolidating
its gains of the past 2 months, sitting just below its old high.
Last week the stock finished above important resistance, 41.43 (the 50%
retracement of the 5/97-2/99 decline), after having tested and failed to
close above this resistance during the previous 2 weeks. Weekly OBV
hit a new high on Friday, adding further confirmation to the stock's
recovery from its brief early month selloff.
A
buy signal would be given on a break above 42 to new 52-week highs.
On a break, the stock would next run into resistance at 45.56 (the 62%
retracement of its '97-'99 decline), and then at 48.75, and 51.31.
The 21 day moving average (39.83) could be used as a trailing stop.
The 21-day has acted as support since the stock moved above it on
9/29.
|

DISCLAIMER
|
