|
Home
Up
Co-brand
Partnerships


| |
| 2/18/99 International Business
Machines (IBM)
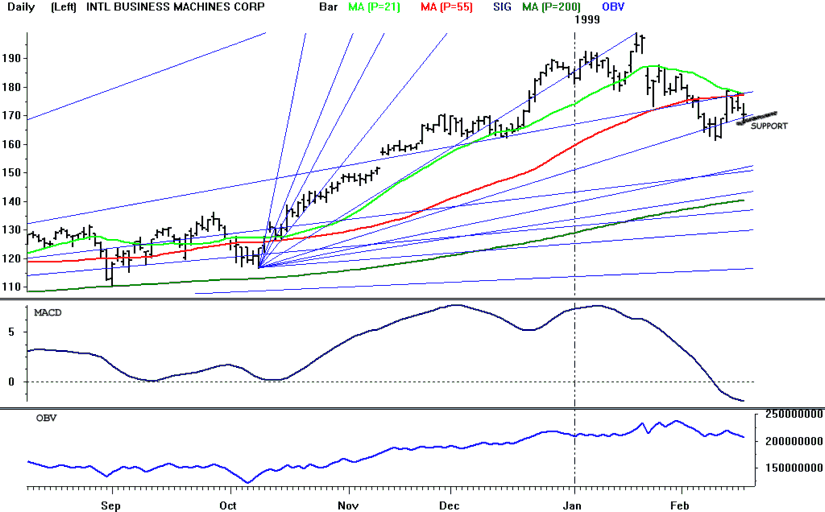
Points to watch: IBM has been in a
correction since peaking in mid January. The stock has been flirting with Gann angle
support (now at 169.63) since February 5th but has managed to hold support. During
its rally from last Wednesday to this Tuesday, the stock met resistance at the Gann 2x1
angle and was unable to rally above it--a bearish signal. This angle has acted as a
support/resistance point since June 1998. On Tuesday IBM fell beneath both its 21
day (177.14) and 55 day (177.69) moving averages. The 21 day moving average has
crossed slightly below the 55 day for the first time since moving above it last October.
Technical indicators continue to weaken. Weekly and daily MACD both gave sell
signals in late January. Weekly RSI, stochastics, and daily OBV are all in
downtrends. The stock may be shorted by aggressive traders on a break below support
at 169.63. More conservative traders should wait for both of the following to occur:
a.Weekly ADX (now at 47) to fall below 40, and b. the stock to break below the support
band at 159.8 (the 25% retracement of the 1/96-1/99 rally)-161.75 (last week's lows)
before shorting. On a break below 159.8 IBM would likely find support near its 200
day moving average at 140.
|

|
