|
Home
Up
Co-brand
Partnerships


| |
| 2/16/99 Fleet Financial Group
(FLT)
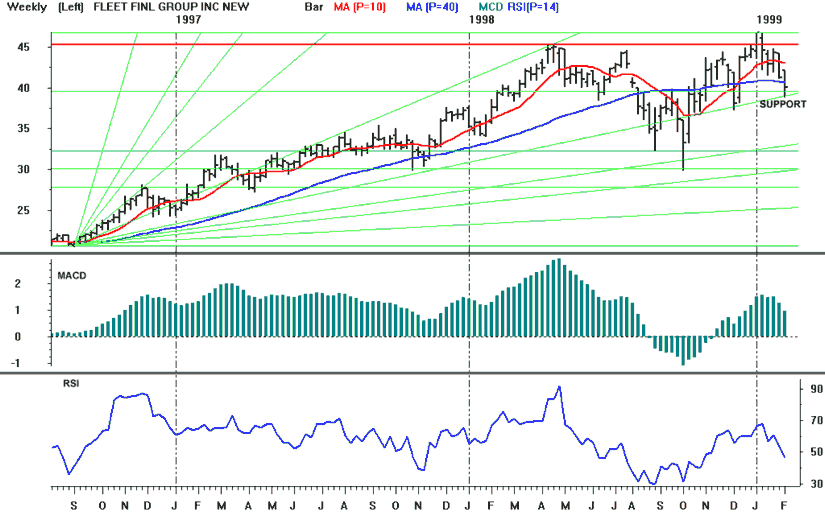
Points to watch: A longer term double top
is forming on Fleet's weekly chart with tops in April 1998 and January 1999 at 45-46.
Weekly MACD and weekly RSI both showed strong negative divergences with price
during the January peak. Weekly RSI turned down sharply in January and has fallen
below 50. Weekly MACD gave a sell signal on February 5th and daily MACD gave a sell
signal on January 12th. Longer term indicators are also negative: monthly RSI has
been in a downtrend since late April 1998, and monthly MACD remains on the sell signal
given in late July. FLT has fallen below its 10 week moving average (43), and this
week closed below both its 200 day moving average (40.65) and the38% retracement level (of
the October-January rally, 40.39). Strong support exists directly underneath from 39
(Gann, provided support in December) to 39.8 (the 25 % retracement of both the July
1996-January 1999 rally and the 25% retracement of the 2/95-1/99 rally). The
stock tested and held both support levels on a closing basis last week. The
continuing weakness of technical indicators, combined with the double top pattern, makes
another run at these support levels likely this week. Sell, or short, if Fleet
breaks below 39.
|

|
