Clear Air
Traders turn profits by anticipating
price movement. Although this sounds simple, many market participants don’t
understand how to locate impending change. Stock prices move back and
forth endlessly. But when do these common swings represent good trades and
when are they just dangerous noise? One answer lies in the relationship
between price and time.
The singular goal of trading can be
defined as locating price expansion just before it happens and taking a
position to capitalize on the event. When price moves a greater distance
over a lesser period of time, individual chart bars and candlesticks
expand in length. This range expansion signals those points of greatest
opportunity for traders and investors.
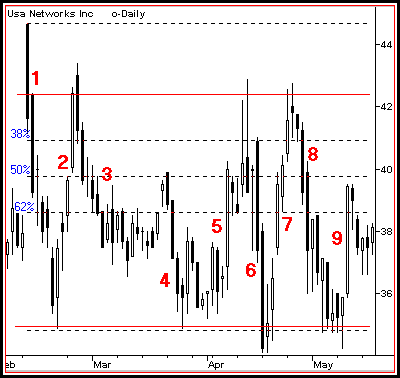
Clear Air identifies horizontal chart
levels where prior stock trends exhibited sharp price expansion in either
direction. The stronger the CA event, the more likely that price will
trigger volatility on the next pass. This tendency allows traders to
locate outstanding trades with little more than quick visual scans of
their favorite stock charts. CA prediction is simple: the more often those
bars expand through the same levels, the more likely expansion will
continue.
Congestion limits volatility. Range
expansion represents the state of least congestion and greatest
volatility. However, it cautions traders to manage risk closely as
opportunity and danger stand side by side. Although price may have sharp
momentum in one direction, defense trading must be exercised. Clear Air
space can produce violent reversals.
Predicting natural swing points in
pre-existing Clear Air utilizes only known support/resistance and
fibonacci retracement levels. Since traders tap detailed price and volume
from prior passages, those points can be used for cross-verification to
reduce risk. High probability setups can be easily identified with natural
entry and exit triggers.
Clear Air exists at new highs and lows
as well as prior price breaks and trends. But locating safe positions in
this Clear Air requires detailed fibonacci projections and may lead to
conflicting outcomes. Only disciplined traders should play on this
dangerous field. Major breakouts and breakdowns often print few congestion
and swing points that traders can use to identify support/resistance. And
positions must be taken without the benefit of information from prior
passages through the same price levels.

Apply a fibonacci grid after a Clear
Air series to reveal hidden reversal zones not apparent during the event.
Try placing a grid over new sharp expansion moves to anticipate where
opportunities will emerge on next retracement swing. When trading Clear
Air, always rely on the chart in the next smaller time frame to locate low
risk entry and exit levels.
