Volatility
Measuring volatility opens the door to
successful price prediction. But first take the time to understand exactly
what it means. The financial media overuses this important concept to
describe any market movement that they don’t understand. And baby-faced
analysts fall back on it constantly to explain their bad predictions. So
how do traders use this valuable tool without getting caught in useless
labels?
TASC (Technical Analysis of Stocks and
Commodities) describes volatility as "a measure of a stock's tendency
to move up and down in price, based on its daily price history over the
latest 12 months". While their definition fixes upon a single time
frame, it illustrates the relativity aspect of market movement. Over time,
markets take on unique characteristics that can be measured through price
swings. One well-known example is price rate of change or the average
number of points that a stock moves over a specified period of time.
Volatility builds on this quantitative
analysis of price by removing direction from the equation. It stretches
pure increments of price change so that their relative travel can be
measured. The greater the distance over time, the more volatile the
market. But pure volatility has little value for traders if they can’t
base price prediction upon it. Fortunately volatility has a characteristic
that contributes to profitable trading. It tends to move in cyclical
patterns.
Markets expand and contract endlessly.
As prices ebb and flow, volatility moves cyclically between active and
inactive states. Relatively new (outside the options world at least)
techniques have developed over the last 15 to 20 years for analysis of
this phenomenon. Many tools now focus on the relationship between price
swings over time and their current movement. Others predict the future
through the pattern of wide and narrow range price bars.
As ranges contract, so does volatility.
Like a coiled snake, markets approach neutral triggers from which sharp
price movements erupt. Properly tuned indicators can identify these
trend-range interfaces and offer a powerful supplement to classic pattern
analysis. Use charting software with range analysis functions to extract
this information directly from chart patterns.
Technicians can also capture these pivot
points using pattern recognition. The impact of narrow and wide range bars
has been known in the futures community for years. Application of this
important analysis to equities is just reaching maturity, as very short
term trading becomes part of the stock market landscape. Read works by
Raschke, Crabel, and Taylor to polish your trade execution skills with
this important concept.

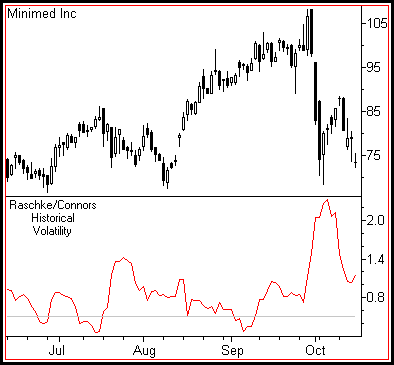
Complex indicators capture cyclical
changes in volatility, regardless of relative price movement. Raschke/Connors
Historical Volatility, a recent addition to the technical arsenal,
predicts impending price movement but not necessarily direction. Skilled
traders apply a dual strategy and either go long or short depending on
outcome.
