|
Home
Up
Co-brand
Partnerships


| |
|
9/30/99
IBM Corp (IBM)
Points to watch: One
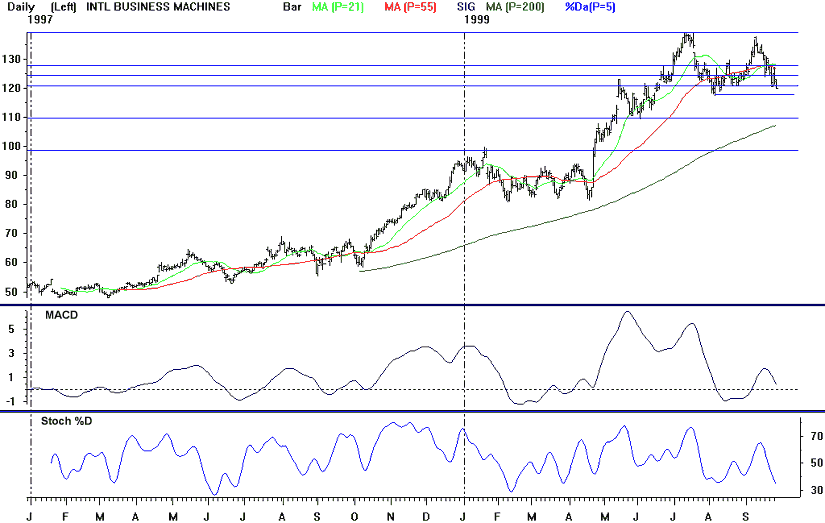
to watch in the coming days. IBM's chart is looking ominous.
The early September run at the July highs failed, and a double top is
forming on the stock's chart, a pattern that is given added weight by the
strong negative divergences shown by MACD and RSI at the September
high. MACD, RSI, stochastics, and OBV have all turned down and are
falling. The stock closed yesterday at the 62% retracement of its June
2nd- July 13th rally. The double top would be confirmed if the stock
breaks below the August 5th low of 117.56, and a sell signal would be
given, with the stock likely to next pull back to its 200 day moving
average at 107.
|

DISCLAIMER
|
