Past Charts ] Week Ahead ] [ Market Charts ] Tulips AM ] Traders Wheel ] Emerging Markets ] Futures Charts ] MarketCall ] Breakout Watch ] Wall St. Trader ] Economy ] Tulip News ] Merger Watch ] Dividend Increases ] Stock Buybacks ] Earnings Warnings ] Tulip Index ] Tulip Trend ] Short Interest ] Daily Screens ] Traders Talk ] TA from siXer ] Forex News ] Federal Reserve ] TulipsIntra ] Calendars ] Commodities ] Reality Charts ] Stocks to Watch ] Upgrade/Downgrade ] Mutual Funds ] Reality Check ] Daily Reckoning ] Global Capital Daily ] Feature Stories ] Layoff Rundown ] Opinion Index ]

Home
Up
Monday
Tuesday
Wednesday
Thursday
Friday

Co-brand Partnerships

award-5.gif (6517 bytes)

topsite.gif (1668 bytes)

webfifty.gif (6027 bytes)


drop_center.gif (2753 bytes)


wpe1.jpg (2095 bytes)


FREE EMAIL
Email Login
Password
New Users Sign Up!
 
MAILING LIST
Sign up for our weekly e-mail newsletter!
Tell Me More!

Enter your e-mail address
subscribe
unsubscribe
NEWS SEARCH
WEB DIRECTORY
WEB SEARCH
 CITY GUIDES
search by:
 WEATHER

Current Weather
Enter Your City, State, or Zipcode:


MASTERING
THE TRADE

ORIGINAL, INTERACTIVE SEMINAR ON TRADING USING
TECHNICAL ANALYSIS


EARNINGS ESTIMATES

Enter Symbol

U.S. QUOTES

Enter Symbol:

U.S. CHARTS

Enter Symbol:

TECHNICAL OPINION

Enter Symbol:

CANADIAN CHARTS

Enter Symbol


 SEC FILINGS

Search For:
 

Company Name
Ticker Symbol

 BROKER RESEARCH
Exclusive Broker

Research
Enter Ticker


Click here for:    Today's Chart    Market Charts            Past Charts        The Week Ahead   Trader's Wheel  INTERACTIVE CHARTING  
Mastering the Trade   Quick Futures Charts  Daily Trend Signal   
  Market Call    Wall Street Trader    U.S. STOCK INDEXES  CANADIAN STOCK INDEXES
TODAY'S BEST & WORST INDUSTRIES

DAILY MARKET CHARTS

7/10/01: 
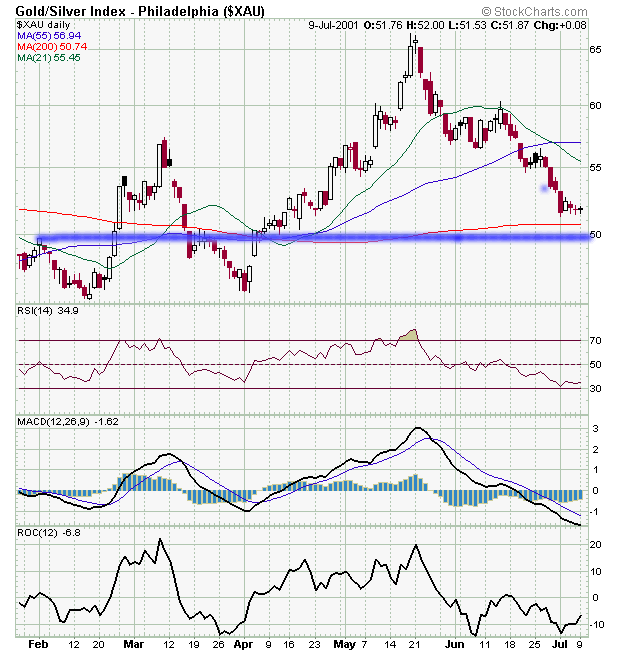
.XAU Gold/Silver Index 

Since reaching an overbought high of 66.54 on May 18th following a rapid 6-week runup, the .XAU has entered a steady freefall, giving back almost all of its 4/3-5/18 gains. The index is now at critical support at the 61.8% retracement (51.146) of its rally from the 10/27/00 low of 41.61. Additional strong support exists from 48.5-49.7. RSI, MACD, OBV, and Stochastics continue to decline, and have yet to reach oversold territory. A retest of the 48.5-49.7 support is likely in the near term, with the next major support then at 45.6-46.0 (a level that held in both February and April), and at October's low of 41.6. Upside resistance is at 54.1 and 57 (strong resistance).

Chart Courtesy of Stock Charts.com

The Week Ahead   Monday  Tuesday  Wednesday  Thursday  Friday

DISCLAIMER

 
Search for it at the TulipSearch Open Directory
Investment Bookstore Investment Newsstand Market Mavens Report

TULIPS AND BEARS NETWORK SITES


FINANCE
Tulips and Bears
Contrarian Investing.com
Internet Stock Talk
Traders Message Boards
Traders Press Bookstore

NEWS AND INFORMATION
TulipsWeather
Freewarestop.com
TulipsMail
TulipsEspa�ol
TulipSearch
TulipNews
TulipCards
AllMusicSearch.com
City Guides
Travel Center
Bargain Bloodhound

WEBMASTER TOOLS

BecomeAnAffiliate.com
TulipDomains
GoSurfTo
TulipStats
TulipHost...coming soon
TulipTools...coming soon
...coming soon


Questions or Comments? Contact Us

Copyright � 1998-2002 Tulips and Bears LLC.
All Rights Reserved.  Republication of this material,
including posting to message boards or news groups,
without the prior written consent of Tulips and Bears LLC
is strictly prohibited.  'Tulips and Bears' is a registered trademark of Tulips and Bears LLC


Last modified: December 02, 2001

Published By Tulips and Bears LLC