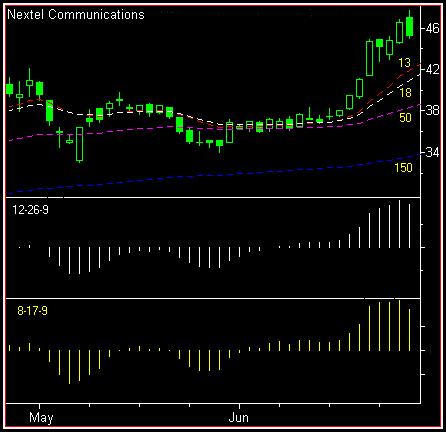
Breakout
Roots
As stocks push toward uncharted territory, skilled traders
can examine the impending new high breakout through existing features within the chart
pattern. Final phases of congestion often print sharp initiation points for the breakout
impulse. Locate this hidden root structure in double bottom lows embedded within the
congestion, just prior to the trend move. The distance between these lows and the top
resistance boundary will yield price targets for the subsequent rally. Barring larger
forces, this new high breakout should extend no more than 1.38 times the distance between
that low and the resistance top before establishing a new range.
Once a new high base is finally cleared, the bull impulse
escapes the gravity of final congestion. This often triggers a dramatic 3rd wave for the
trend initiated at the congestion low. This thrust can easily exceed initial price targets
when it converges with larger scale wave movement. In other words, when forces in the
daily and intraday charts move into synergy, trend movement will inevitably be more
dramatic than anticipated.
Measure the ongoing new highs with a MACD Histogram or
other widely used momentum indicator. Whatever your choice, allow your math to support the
pattern rather than the other way around. For example, if an established trendline can be
drawn under critical lows, your trade timing should be keyed off that line rather than
waiting for your indicator slope to turn up or down.
Effective trading of post-gravity impulses relies on the
interaction between current price and your momentum indicator. At new highs, prior
support/resistance can't be used to predict swings. Follow the MACD slope to flag
overbought conditions favorable for the development of ranges or reversals. Enter long
positions when price falls but the slope begins to rise. Or be conservative and wait for
the zero line to be crossed from below to above.
Patterns point to low risk momentum entry. Retracements to
a trendline or moving average identify profit opportunities. Follow this strategy and
you’ll parallel the most successful investment method of this entire bull market:
buying the dips. It works because each price dip brings in new buyers who missed the last
opportunity. Not exactly rocket science but it gets the job done.
Short sale swings should be avoided completely when
momentum is high unless you’re a highly experienced trader. Trying to pick tops is a
loser's game. Most traders can delay short sales until momentum drops sharply but price is
high within its range. Pattern analysis can then locate favorable countertrend entry
points with limited risk.

Traders can take long positions any time momentum is high
as long as tight stops and rigid discipline limit losses. One ideal chart pattern will
exhibit accelerating price movement with expanding price bars and volume. Combine this
with rising MACD spikes and you’ve found a profitable entry strategy. Or look for
this dynamic state through the spreading width between short and long averages on Moving
Average Rainbows.
