G
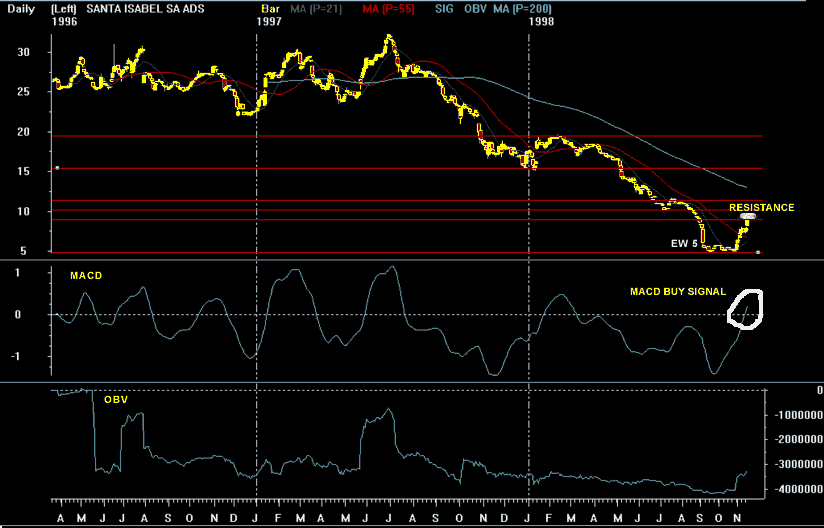
11/16/98 Santa Isabel (ISA) Points to watch: Stock completed Elliott Wave 5 down (EW 5) on daily chart and is breaking out to upside. Closed Friday above strong resistance at 8.47-8.75 and above 100 day moving average at 8.8. Current rally is occurring on heavier than average volume. Daily RSI is in an uptrend and daily OBV has turned up. The daily MACD signal line has crossed above 0, giving a buy signal. Weekly RSI, MACD, and stochastics have given buy signals. Weekly OBV has turned up. Buy on second close above 9. Downside support exists at 8.47, and 6.32-6.69. |
