Level II and
the Chart
The Level II screen provides the
important interface between general knowledge of stock charts and
execution of specific trading strategies. Consistent market profits
require insight and skill into both disciplines. Many excellent technical
analysts lose money due to tape reading incompetence. On the other hand,
expert screen readers often disregard input from their technical labors
and succeed by trading the tale of the tape.
Numbers are the fuel of the markets. In
fact, stock action is nothing more than numbers and their rate of change
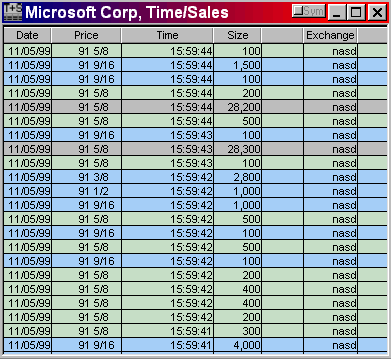
over time. Watching price pulses on time/sales logs offers the most
accurate method available for very short-term price prediction. Emotions
of fear and greed reveal themselves quickly through these rapid bursts of
trading activity.
Turning a profit or loss on any trade
results from four decisions: picking a market, choosing to go long or
short, finding a point of entry and exiting the position. For the
short-term trader, correctly reading the message of the Level II screen is
critical to the success of each of these decisions.
While initial stock picking results from
effective market scanning and detailed technical analysis, no two markets
trade alike. After you choose your stocks, periods of passive LII
observation before trading them is highly recommended and well worth the
effort. A popular chart pattern may generate great excitement but have
tape action so undesirable that the choice must be abandoned.
You can read Level II by uncovering
answers to a series of questions: How do the spreads move? Who is moving
them? How do they widen and contract? What times of day do the issues tend
to act and react? When do they make their highs or lows? How easily do
they violate the first hour’s range? What happens during the first and
last 15 minutes of the market day? What happens during lunch hour? How
easily do they gap from close to open?
Th
Level II will cross-verify stock chart
observations, improve risk: reward profile significantly and add to
profits. Swing traders must watch for price change momentum that is
countertrend to the direction of intended entry. The opposite is true for
breakout traders who must see evidence of synchronization with their
position setups. Bulls must see underlying strength even through
countertrend pivots while bears look for distribution interrupted by
feeble rallies or sharp short squeezes.
The most common use of Level II seeks to
pinpoint entry and exit. Of course this is where most traders fail. Prior
research generates wishful or fearful thinking and results in highly
flawed decision making. Instead of waiting for legitimate signals, they
focus on meaningless price movements that support the bias of the trader.
More than any other market skill, tape reading requires detachment that
must overcome common emotional obstacles and barriers to clear vision.

Many technical traders ignore time/sales
logs and prefer the graphics of short-term bar charts. But for intense
study of very short-term price volatility, this flow of buying and selling
pressure offers important information. Bar charts contain little data on a
market's changing spread. Level II and time/sales highlight spread
movement that provides clues to the intentions of the market makers, how
they interact with each other and the ultimate direction of price.
