Home
Up
New Page 10

Co-brand Partnerships

award-5.gif (6517 bytes)

topsite.gif (1668 bytes)

webfifty.gif (6027 bytes)


drop_center.gif (2753 bytes)


wpe1.jpg (2095 bytes)


FREE EMAIL
Email Login
Password
New Users Sign Up!
 
MAILING LIST
Sign up for our weekly e-mail newsletter!
Tell Me More!

Enter your e-mail address
subscribe
unsubscribe
NEWS SEARCH
WEB DIRECTORY
WEB SEARCH
 CITY GUIDES
search by:
 WEATHER

Current Weather
Enter Your City, State, or Zipcode:


MASTERING
THE TRADE

ORIGINAL, INTERACTIVE SEMINAR ON TRADING USING
TECHNICAL ANALYSIS


EARNINGS ESTIMATES

Enter Symbol

U.S. QUOTES

Enter Symbol:

U.S. CHARTS

Enter Symbol:

TECHNICAL OPINION

Enter Symbol:

CANADIAN CHARTS

Enter Symbol


 SEC FILINGS

Search For:
 

Company Name
Ticker Symbol

 BROKER RESEARCH
Exclusive Broker

Research
Enter Ticker


The Traders Wheel
10/10/99 by Alan Farley

3x3 Market Analysis

Skilled traders learn to recognize the trend by watching price react to other important levels. Focusing on key relationships, they effectively predict market moves through convergence or divergence over a small number of price bars. Learn to read this powerful axis of price change with three sets of technical indicators that answer three important questions:

What is the trend or range intensity?
What is the direction of the next price move?
When will this price move occur?

All stock movement can be characterized as alternating between trend and range. This observation is true for all time frames. Markets move through a constant cycle of synergy, balance and conflict as trend intensity and direction shift alignment through different period views. The strongest trends arise when multiple time frames stack up into directional positive feedback. The most persistent ranges emerge when discontinuity increases the noise of negative feedback through many periods and stalls price change.

Technical indicators have difficulty viewing both trend and range at the same time. As a result, important formulae tend to align along specialized paths that focus on one or the other. Use trend-following tools such as moving averages, MACD and price ROC to look into the rear view mirror and establish trend strength, momentum and direction. Then reach forward with RSI, Stochastics and other oscillators to inspect swing range cycles that trap markets between measurable extremes.


You can investigate a poorly understood quirk of market behavior using a third class of indicators. Standard deviation and reversion to the mean reveal a strong bias for markets to return to neutral states following supply/demand price swings. Traders exploit this market behavior when they can locate extreme price zones.

Price channel construction provides an excellent source for deviation analysis. Popular tools such as Bollinger Bands identify price imbalance where reversals should occur. They also point to narrow congestion where breakouts will develop. Even a simple Parallel Price Channel will locate natural price extremes where the best trading opportunities exist.
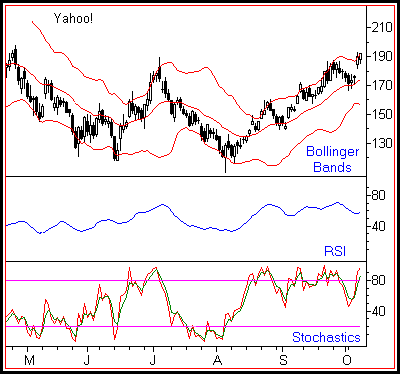
View all three sets of indicators on a single price chart for a quick snapshot of the current trend. When all views converge and are verified by the price pattern, the odds for a sharp directional move greatly increase.


Alan Farley is a full-time trader and author residing in Denver, CO. He publishes The Hard Right Edge premier web site for trader education, technical analysis and trader resources featuring both Morning Trader and Traders Workshop. The site provides traders with comprehensive resources including original tactics and strategies on multi-trend technical analysis and short-term trading .

  Alan also authors on-line training technical analysis in association with independent sites. His most recent publications include the Mastering The Trade on-line workshop, Momentum: Riding The Tiger, and Time of Day. In addition to writing, he is an outstanding speaker and lecturer on short term trading strategies.

 He has been featured in Barrons, Smart Money magazine, Tech Week, MoneyCentral and TheStreet.com.


Search for it at the TulipSearch Open Directory
Investment Bookstore Investment Newsstand Market Mavens Report

TULIPS AND BEARS NETWORK SITES


FINANCE
Tulips and Bears
Contrarian Investing.com
Internet Stock Talk
Traders Message Boards
Traders Press Bookstore

NEWS AND INFORMATION
TulipsWeather
Freewarestop.com
TulipsMail
TulipsEspa�ol
TulipSearch
TulipNews
TulipCards
AllMusicSearch.com
City Guides
Travel Center
Bargain Bloodhound

WEBMASTER TOOLS

BecomeAnAffiliate.com
TulipDomains
GoSurfTo
TulipStats
TulipHost...coming soon
TulipTools...coming soon
...coming soon


Questions or Comments? Contact Us

Copyright � 1998-2002 Tulips and Bears LLC.
All Rights Reserved.  Republication of this material,
including posting to message boards or news groups,
without the prior written consent of Tulips and Bears LLC
is strictly prohibited.  'Tulips and Bears' is a registered trademark of Tulips and Bears LLC


Last modified: April 02, 2001

Published By Tulips and Bears LLC