Pattern
Volume
New students of technical analysis
believe profits come quickly by memorizing well-known patterns and
locating them on their favorite stock charts. But flags, triangles
and head & shoulders don’t fill wallets without
considerable effort. Successful traders take the time to examine each
chaotic swing within a congestion pattern to predict both the direction
and timing of the eventual breakout.
Profitable positions depend on
accurately reading the shifting emotions within the trading crowd. No tool
provides better insight into this critical study than volume. Short-term
bursts of accumulation/distribution within the confines of a trading range
often reveal the bullish or bearish bias of the pattern.
As price bars snake back and forth,
visually compare the short spikes of buying and selling to see which side
is winning. When volume increases on short rallies and
declines on dips, a bias exists for the bull’s successful outcome.
Alternatively, fear revealed through a series of lower bars with
increasing volume often signals an eventual breakdown. Regardless of
direction, expect volume to decline overall as the pattern develops.
Use volume to locate your trade
execution trigger. The apex of a completed pattern (just before the
breakout) commonly exhibits the lowest participation of any point within
that range. When properly located, traders can measure volume on
subsequent bars to gather important feedback on the direction of the
impending move. For example, if price surges out of an apex without
building volume, odds increase the move will fade and reverse.
Always watch for the Silent Alarm.
This rare one-bar event reflects intense crossroads of buying and selling
pressure. Highly emotional trading spikes volume significantly near the
apex of a pattern but a painful standoff develops and no breakout occurs.
Smart traders recognizing the Alarm stand aside on these days but take
positions in whatever direction price ejects out of that bar’s range.
 |
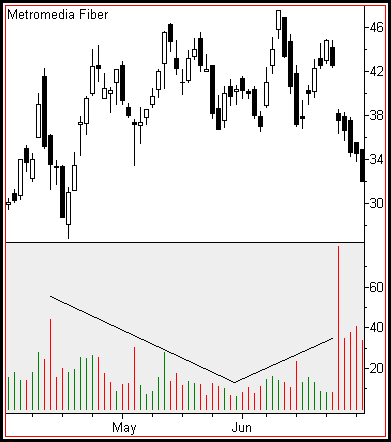
| The lowest volume
within a pattern may not occur near its apex. As MFNX demonstrated
in spring of 1999, congestion can pivot off a quiet center point
between two zones of increased volatility and participation. |
