|
Home
Up
Co-brand
Partnerships

Vote
for Us


| FREE
EMAIL |
|
| |
| NEWS
SEARCH |
|
| WEB
DIRECTORY |
|
| WEB SEARCH |
|
| CITY
GUIDES |
| WEATHER |
|
|
MASTERING
THE TRADE
ORIGINAL, INTERACTIVE
SEMINAR ON TRADING USING
TECHNICAL ANALYSIS
|
| |
| EARNINGS
ESTIMATES
|
|
|
| U.S.
QUOTES |
|
|
| U.S.
CHARTS |
|
|
| TECHNICAL
OPINION |
|
|
| CANADIAN
CHARTS |
|
|
|
SEC FILINGS
|
|
|
| BROKER
RESEARCH
|
|
|
|
| |
|
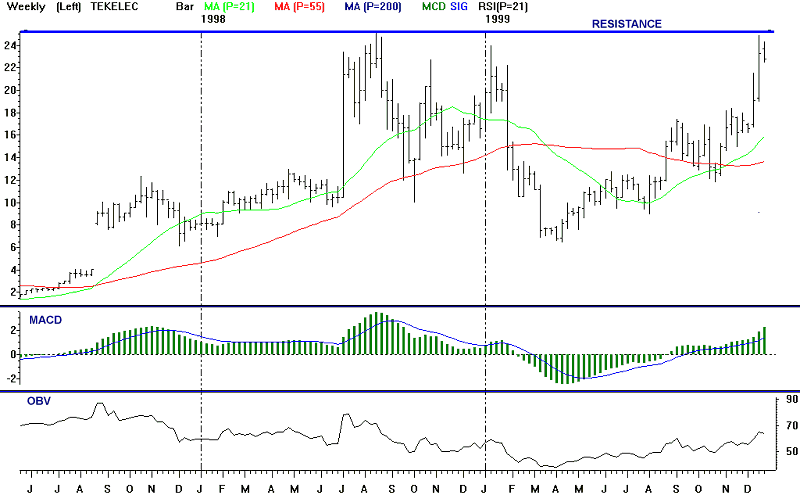
12/28/99 Tekelec (TKLC)
Points to watch:
TKLC has rebounded sharply since
bottoming at 6.50 in mid-April and is now approaching its old highs at
25.25, set in August 1998. The stock has tested resistance during
the past 2 trading days, hitting intraday highs of 24.88 and 24.31 on
Thursday and Monday. TKLC finished down 0.44 at 22.81 yesterday, and
is unchanged after the first 15 minutes of trading today.
Technical indicators remain positive:
weekly MACD remains on its late August buy signal, and weekly OBV, RSI,
and Stochastics are rising.
A buy signal would be given on a break
above 25.25 to new highs, with upside resistance at 28, 29.4, and
31.3.
|

DISCLAIMER
|
