|
Home
Up
Co-brand
Partnerships

Vote
for Us


| FREE
EMAIL |
|
| |
| NEWS
SEARCH |
|
| WEB
DIRECTORY |
|
| WEB SEARCH |
|
| CITY
GUIDES |
| WEATHER |
|
|
MASTERING
THE TRADE
ORIGINAL, INTERACTIVE
SEMINAR ON TRADING USING
TECHNICAL ANALYSIS
|
| |
| EARNINGS
ESTIMATES
|
|
|
| U.S.
QUOTES |
|
|
| U.S.
CHARTS |
|
|
| TECHNICAL
OPINION |
|
|
| CANADIAN
CHARTS |
|
|
|
SEC FILINGS
|
|
|
| BROKER
RESEARCH
|
|
|
|
| |
|
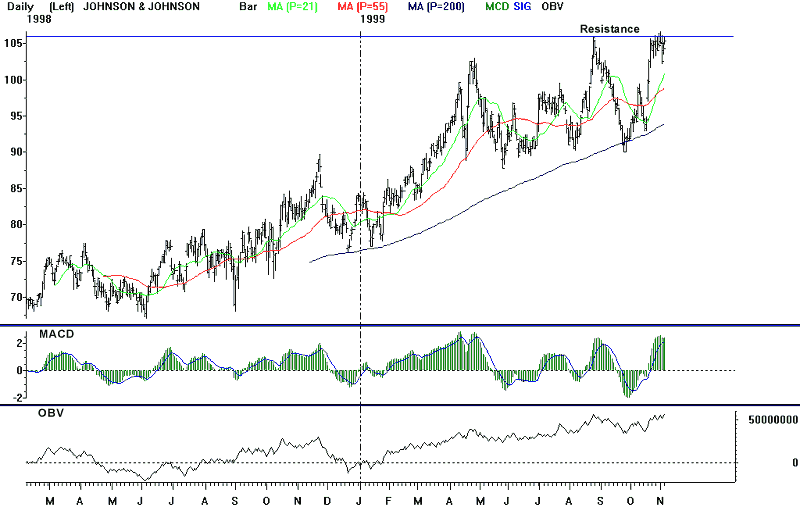
11/05/99 Johnson & Johnson (JNJ)
Points to watch:
After hitting an all-time high of 105.88
on August 25th, JNJ declined along with the broader market in September,
before finding support at, and bouncing up off of, its 200 day moving
average. The stock quickly rallied back to its old highs, but so far
has been unable to break out to new closing highs despite several intraday
moves above the old high.
The stock has spent the past 2 weeks
consolidating its gains, trading in a narrow range between 102 and 106.5.
Technical indicators have continued to strengthen during this two week
period, with both daily and weekly OBV moving to a new high, and
stochastics, Money Flow, and RSI continuing to work their way high.
We expect the stock to break out of this narrow range to the upside, with
the area between 102-106.5 becoming a solid support zone.
A buy signal would be given on a break
above the November 1st intraday high of 106.68.
|

DISCLAIMER
|
