MU ] AAPL ] GE ] AVP ] SUNW ] [ CVS ] PGO ] VNT ] BRKS ] N ] RXSD ] VOD ] ATW ] T ] LEH ] ITW ] NVLS ] MIKE ] UIS ]

Home
Up

Co-brand Partnerships

award-5.gif (6517 bytes)

topsite.gif (1668 bytes)

webfifty.gif (6027 bytes)


drop_center.gif (2753 bytes)


wpe1.jpg (2095 bytes)


FREE EMAIL
Email Login
Password
New Users Sign Up!
 
MAILING LIST
Sign up for our weekly e-mail newsletter!
Tell Me More!

Enter your e-mail address
subscribe
unsubscribe
NEWS SEARCH
WEB DIRECTORY
WEB SEARCH
 CITY GUIDES
search by:
 WEATHER

Current Weather
Enter Your City, State, or Zipcode:


MASTERING
THE TRADE

ORIGINAL, INTERACTIVE SEMINAR ON TRADING USING
TECHNICAL ANALYSIS


EARNINGS ESTIMATES

Enter Symbol

U.S. QUOTES

Enter Symbol:

U.S. CHARTS

Enter Symbol:

TECHNICAL OPINION

Enter Symbol:

CANADIAN CHARTS

Enter Symbol


 SEC FILINGS

Search For:
 

Company Name
Ticker Symbol

 BROKER RESEARCH
Exclusive Broker

Research
Enter Ticker


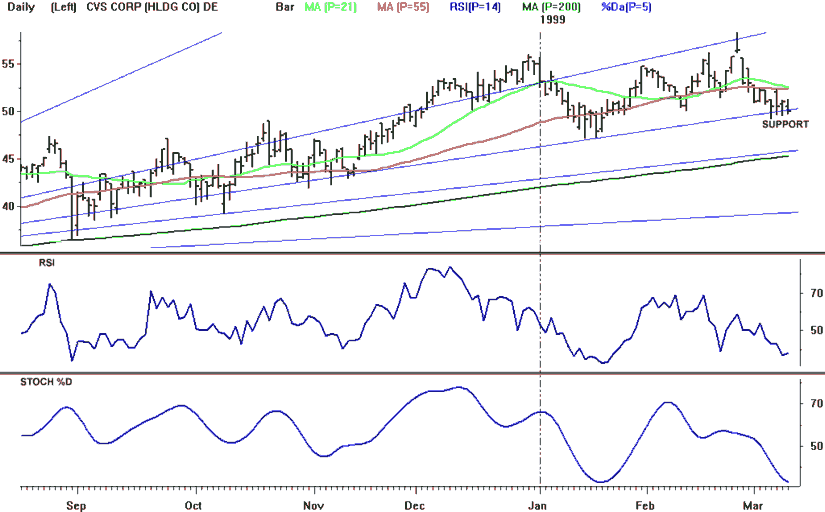
3/10/99  CVS Corp (CVS)


Points to watch:  The drug store stocks have been one of the most consistent performers during the past 3 years but have recently shown signs of topping out.  CVS stock is forming a double top, with peaks in December and February (A move below 47.38, the 50% retracement of the 8/98-2/99 rally is needed to confirm a double top) .  The stock has fallen below both its 21 day (52.59) and 55 day (52.34) moving averages.  The stock closed Tuesday just above the Fibonacci support at 49.9 (the 38% retracement level)  and above important Gann  support at 49.88.  This support angle has acted as support on 3 major tests since October.   A break below support would be bearish, with the next downside support coming at 47.38 and then 45.63.  The 200 day moving average (45.31) will also provide support on a decline.  The 200 day provided support during the September lows, and the stock has remained above it since 1997.  Technical indicators have been deteriorating since late December and did not confirm the stock's February top.  Weekly MACD, OBV, RSI, and stochastics all showed strong negative divergence with price during the February highs.  We would be sellers of the stock on a break below 49.9, with an initial downside target of 47.38 and a second downside target of 45.63.

cvs2.gif (19375 bytes)

 
Search for it at the TulipSearch Open Directory
Investment Bookstore Investment Newsstand Market Mavens Report

TULIPS AND BEARS NETWORK SITES


FINANCE
Tulips and Bears
Contrarian Investing.com
Internet Stock Talk
Traders Message Boards
Traders Press Bookstore

NEWS AND INFORMATION
TulipsWeather
Freewarestop.com
TulipsMail
TulipsEspa�ol
TulipSearch
TulipNews
TulipCards
AllMusicSearch.com
City Guides
Travel Center
Bargain Bloodhound

WEBMASTER TOOLS

BecomeAnAffiliate.com
TulipDomains
GoSurfTo
TulipStats
TulipHost...coming soon
TulipTools...coming soon
...coming soon


Questions or Comments? Contact Us

Copyright � 1998-2002 Tulips and Bears LLC.
All Rights Reserved.  Republication of this material,
including posting to message boards or news groups,
without the prior written consent of Tulips and Bears LLC
is strictly prohibited.  'Tulips and Bears' is a registered trademark of Tulips and Bears LLC


Last modified: April 02, 2001

Published By Tulips and Bears LLC